Statement of Purpose
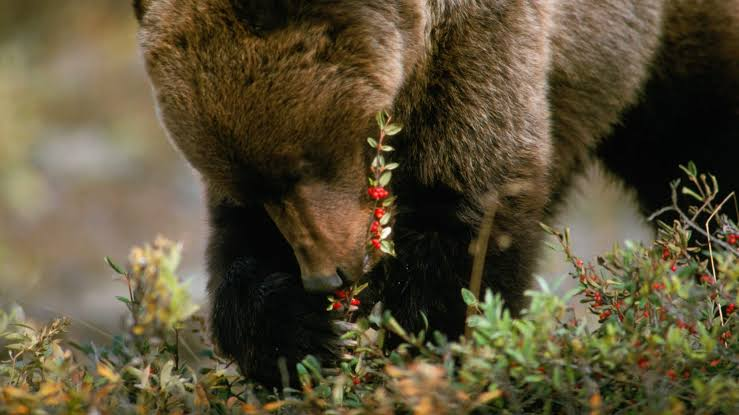
Proper management of wildlife requires a thorough understanding of food availability, and risk of mortality. In southern British Columbia, where there is a greater amount of vegetation-based sources than there are meat-based sources, there is a surge of berry crops during the late summer/fall in the months of August and September. This surge is ideal for bears during their hyperphagia to deposit as much fat as possible for hibernation during winter (McLellan and Hovey, 1995). However, the abundance of plant based sources for bears can be affected by anthropogenic activity. For example, after the felling of trees by logging companies, the patches of forest (cutblocks) receive high exposure to sunlight, promoting and speeding up the growth of vegetation in its early seral stage. As a result, these cutblocks serve as ideal foraging sites for bears, who will typically feed on huckleberries, clover, and dandelion (Roever et al., 2010). With the cutblocks overlapping with the logging resource roads, this creates an ecological trap for the grizzly bears.
The purpose of this study was to deploy a Multi Criterion Evaluation model to evaluate gaps in protection of grizzly bears (Ursus arctos) on unprotected crown land and come up with a recommendation for grizzly bear recovery in British Columbia.
Data Used
These are the datasets used for this project:
- BC Parks, Ecological Reserves, and Protected Areas
- BC Grizzly Bear Habitat Classification and Rating
- Base Map Online Store
- Forest Tenure Road Section Lines
- Harvested Areas of BC (Consolidated Cutblocks)
Aims and Methods
For this project, all coordinates were in NAD 1983 BC Environment Albers, and the objectives are broken down into three chapters.
Chapter 1
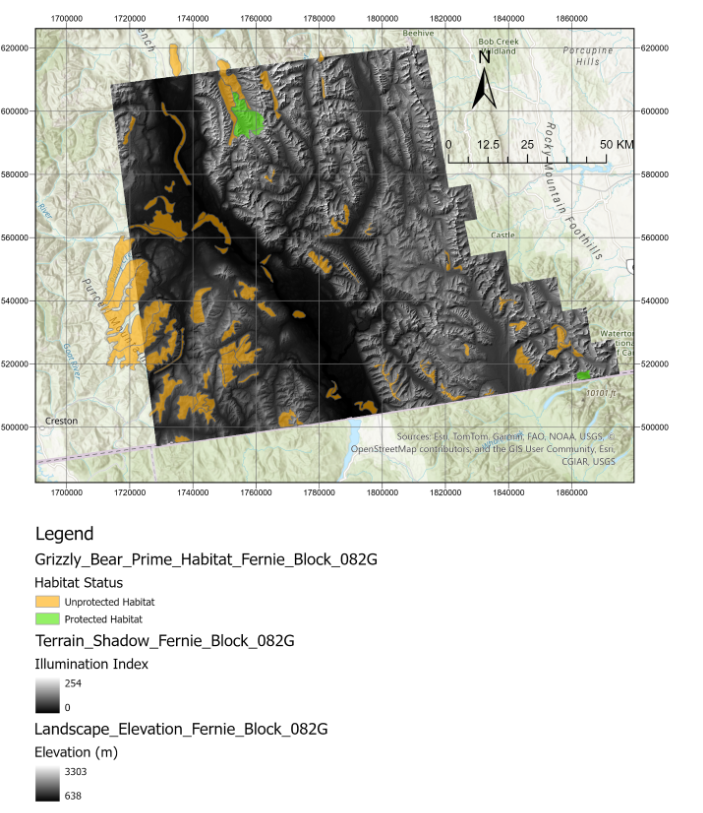
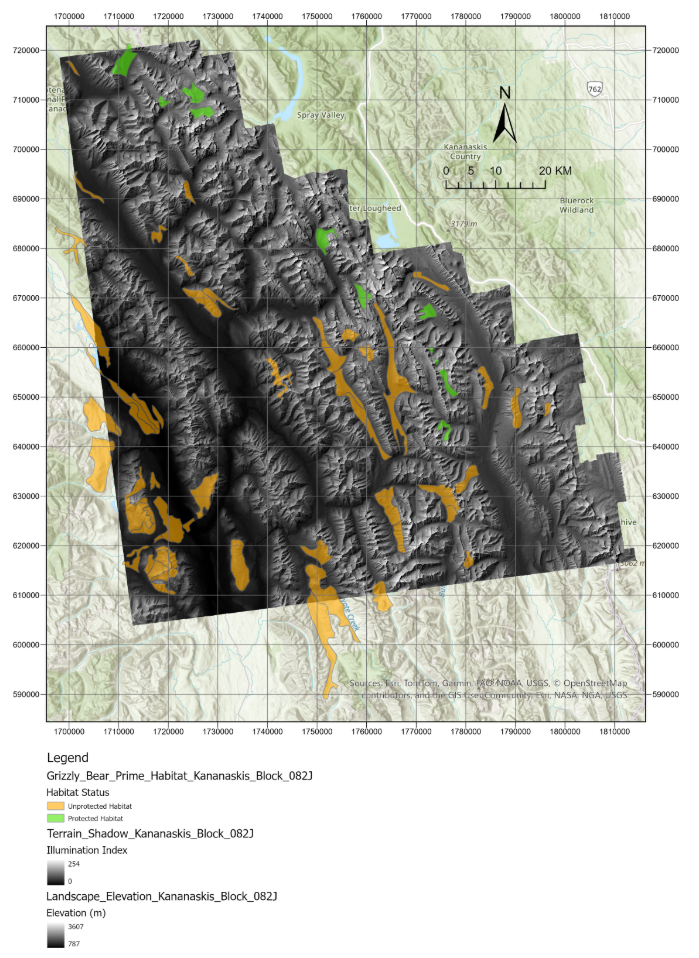
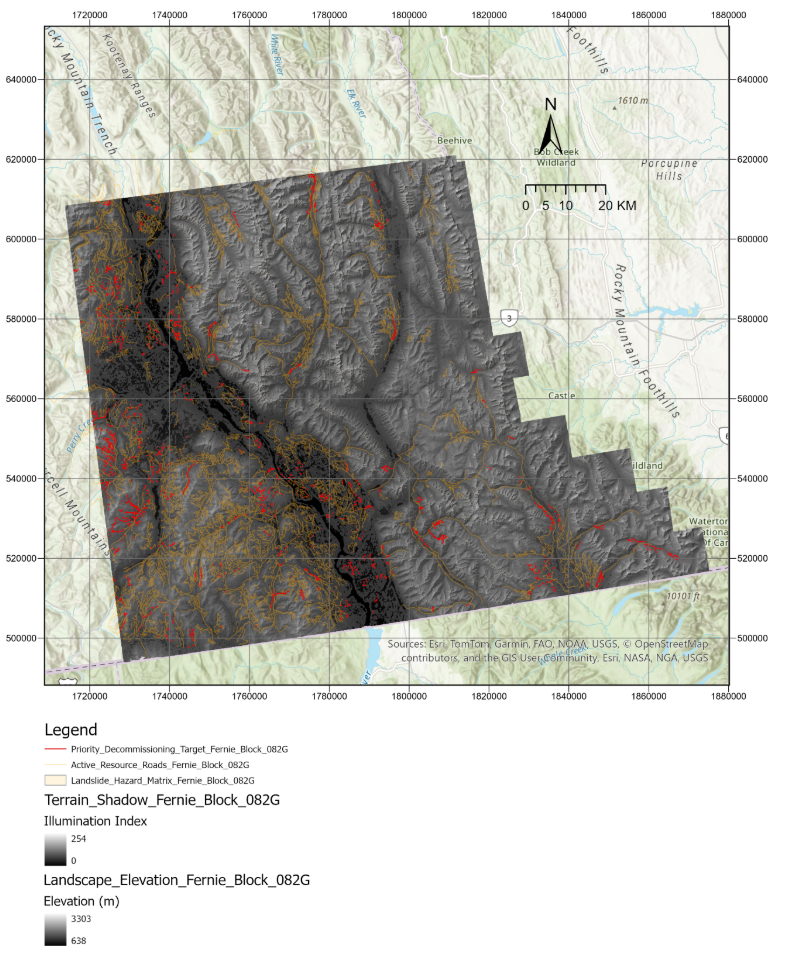
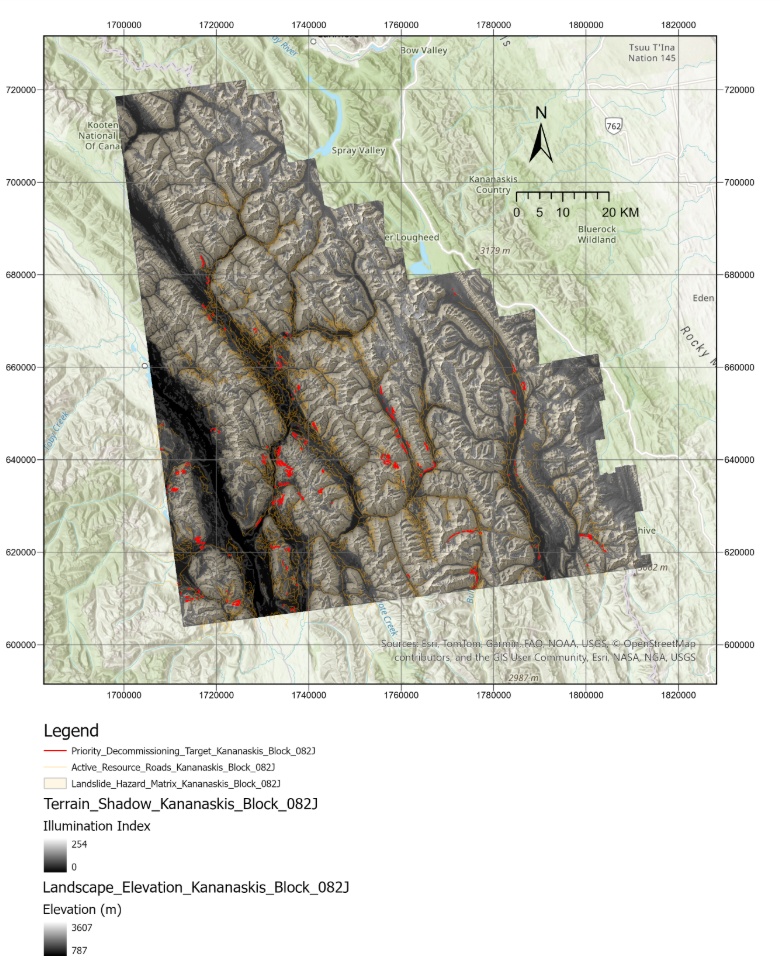
The aim of this chapter was to determine the percentage of prime grizzly bear habitat that lied on unprotected land within the Central Canadian Rockies, and the Eastern Kootenay Regions, and the prime grizzly bear foraging habitat that was situated within the protected area of the provincial parks within the same regions. The data on the provincial parks (BC Ecological Parks, Ecological Reserves, and Protected Areas, No date), and the data on the grizzly bear foraging habitat was acquired from the Grizzly Bear Population Estimates (Grizzly Bear Population Estimates, No date). For this study, polygons chosen as prime grizzly bear habitat were those whose primary vegetation/floral composition was given a suitability score of 1 and 2, which, according to the Impact Assessment Agency of Canada, are ideal foraging grounds for these carnivores (Impact Assessment Agency of Canada, 2019). Raster files of digital elevation models were acquired from the Basemap Online Store from the BC Government Portal (Base Map Online Store, No date). Specifically, the DEM raster grids chosen from the basemap for this project were 82J (Central Canadian Rockies/Kananaskis) and 82G (East Kootenays/Fernie).
After converting all layers into said coordinate system, including the DEM rasters, the Raster Domain tool was performed on each DEM, to create a polygon. This resulting polygon was then used to create individual layers only displaying the provincial parks and the prime foraging habitat that fell within the raster blocks of 82G and 82J. This was achieved using the Select Layer by Location tool.
After all desired layers displaying polygons within the raster grids were created, the Spatial Join was performed. This created a layer with an attribute table, where the column PROT_NAME displayed values that were either ‘Null’, or the names of the provincial parks the prime habitat polygons overlapped with. Using the given total area of the layer resulting from the spatial join, the areas of the habitats within the protected areas of the parks, and of those habitats sitting in unprotected crown land were calculated accordingly.
Finally, the proportions (in percentage) of prime habitat sitting inside the parks, and on unprotected crown land in both grids were calculated.
Chapter 2
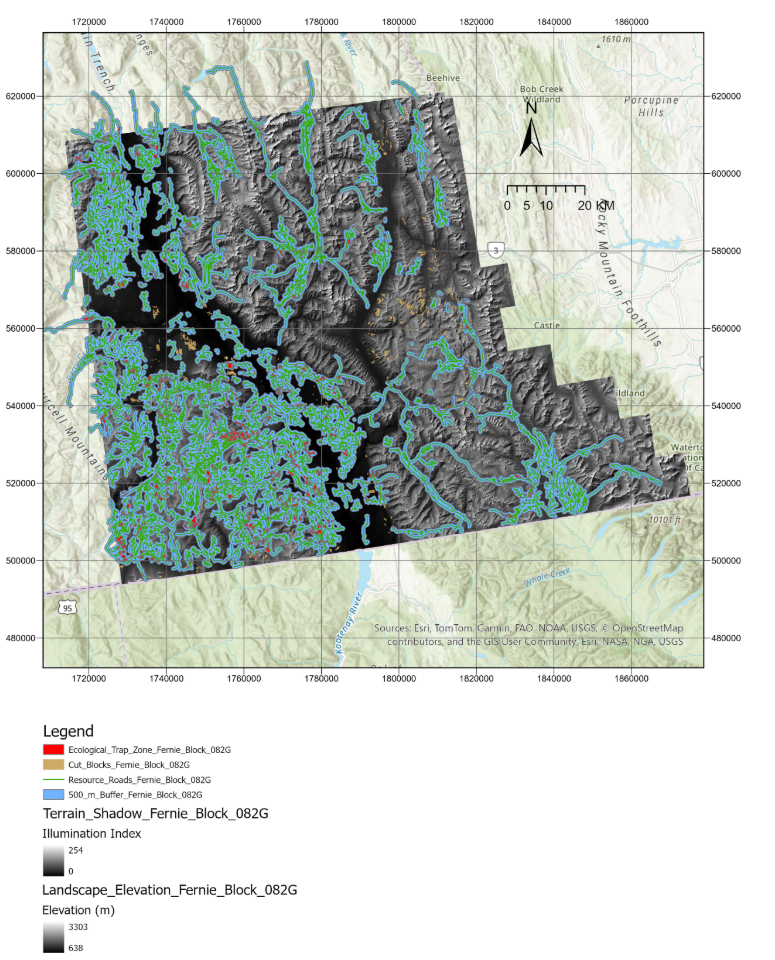
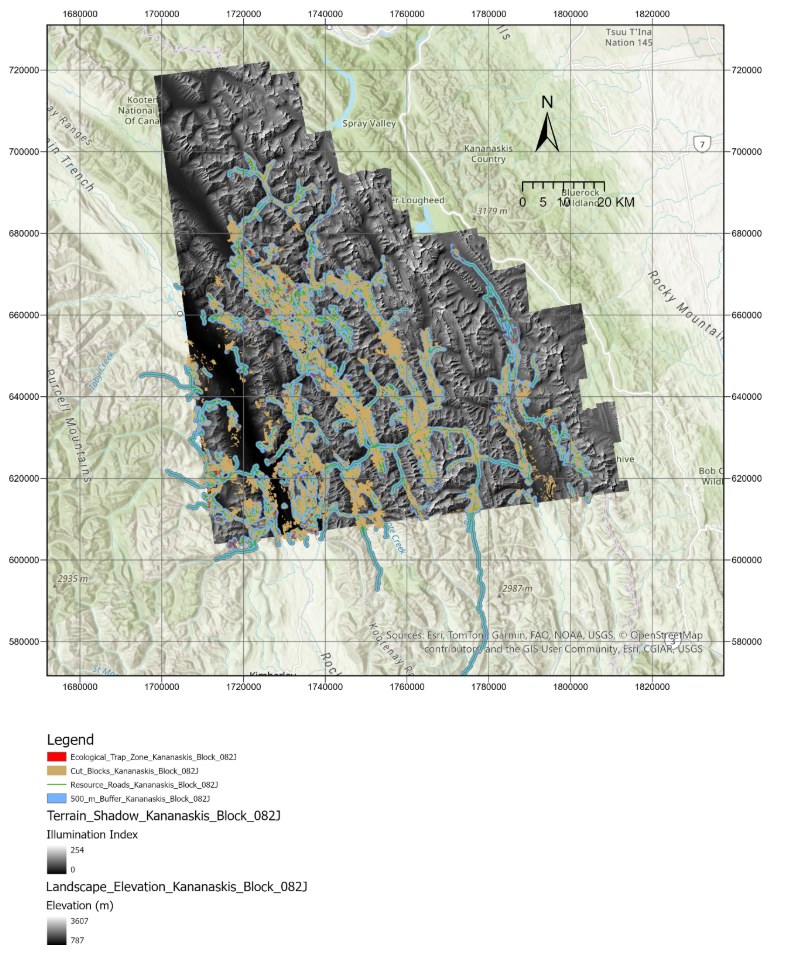
The aim of this chapter was to quantify the overlap between the 500 m buffer around the forest tenure road section line (FTEN_RS_LN) (Forest Tenure Branch, No date) and the patches of cutblocks carved out by logging companies (Harvested Areas of BC, No date).
The cutblock data was adjusted such that the harvest start year was 2020, and the harvest end year was 2025, as seral vegetation growth post-harvest does not begin immediately, but rather, fruit and seral vegetation production flourishes in about 4 to 5 years (Keefer et al., 2010; Hertel et al., 2016).
First, using the Buffer tool, a 500 m buffer was created on either side of the resource roads passing through both blocks 82J and 82G. This 500 m threshold is based on the study by Proctor et al (2019), who concluded that bears will typically avoid foraging within, or suffer the highest mortality within this buffer.
After the 500 m buffer was created, the Intersect tool was used to determine the number of polygons resulting from the overlap of the 500 m buffer and the early seral cutblocks between 2020 and 2025 within 82J and 82G.
Chapter 3
The aim of this chapter was to create a master plan on the decommissioning of inactive resource roads using a Multi Criterion Evaluation, by incorporating data on the steepness of the DEMs.
First, using the Select by Attributes function, the FTEN_RS_LN was filtered such that a new layer within each grid containing only inactive resource roads was created.
After that, the Slope Raster Tool was performed on each DEM grid layer so that they display flat land and mountains with appropriate colour codes.
Upon creating the slope rasters, the Raster Calculator tool was performed on these layers to isolate hills/slopes greater than (steeper than) 15 degrees.
These newly created rasters were converted in polygon vectors using the Raster to Polygon function.
Finally, the Intersect tool was performed to pinpoint and display only those resource roads that collided with steep hillsides above 15 degrees.